 |

NDVI 16-Day Images (2001)
Roll your mouse pointer over each 16-day bar to the right of the image to load the NDVI map for that period.
The first (default) map spans January 1-16, 2001.
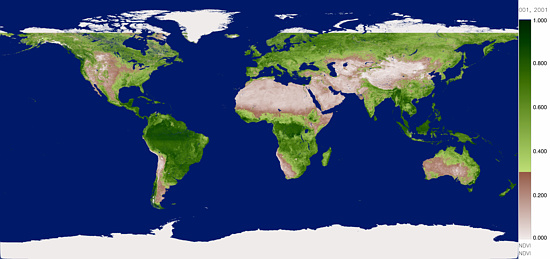
Filled Normalized Difference Vegetative Index (NDVI) Maps 16-Day Averages
|
 JAN
01 - JAN 16 JAN
01 - JAN 16
 JAN 17 - FEB 01 JAN 17 - FEB 01
 FEB 02 - FEB 17 FEB 02 - FEB 17
 FEB 18 - MAR 05 FEB 18 - MAR 05
 MAR 06 - MAR 21 MAR 06 - MAR 21
 MAR 22 - APR 06 MAR 22 - APR 06
 APR 07 - APR 22 APR 07 - APR 22
 APR 23 - MAY 08 APR 23 - MAY 08
 MAY 09 - MAY 24 MAY 09 - MAY 24
 MAY 25 - JUN 10 MAY 25 - JUN 10
 JUN 11 - JUN 26 JUN 11 - JUN 26
 JUN 27 - JUL 11 JUN 27 - JUL 11
 JUL 12 - JUL 27 JUL 12 - JUL 27
 JUL 28 - AUG 12 JUL 28 - AUG 12
 AUG 13 - AUG 28 AUG 13 - AUG 28
 AUG 29 - SEP 13 AUG 29 - SEP 13
 SEP 14 - SEP 29 SEP 14 - SEP 29
 SEP 30 - OCT 15 SEP 30 - OCT 15
 OCT 16 - OCT 31 OCT 16 - OCT 31
 NOV 01 - NOV 16 NOV 01 - NOV 16
 NOV 17 - DEC 02 NOV 17 - DEC 02
 DEC 03 - DEC 18 DEC 03 - DEC 18
 DEC 19 - DEC 31 DEC 19 - DEC 31

|
Larger versions of all NDVI maps, can be downloaded directly from the
NDVI Images directory.
|