|
|
 |

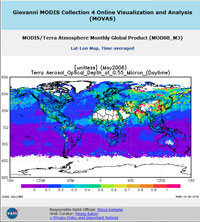
MODIS Online Visualization and Analysis System (MOVAS)
|
A web-based tool designed for visualization and analysis of the Terra / MODIS Atmosphere Level-3 Monthly Product (MOD08_M3).
This product has global coverage with 1° degree spatial resolution mapped on an equal angle lat-lon grid.
Seventeen (17) high-interest parameters were chosen (out of nearly 80 available) to be included in this online analysis system.
Users can plot area average (area plot) and time series (time plot) or generate ASCII output for selected area and time period.
Users can also make comparisons of two parameters.

|
|
Development Team:
 Bill Ridgway / Science Systems & Applications, Inc. Bill Ridgway / Science Systems & Applications, Inc.
Steve Kempler / DAAC - NASA GSFC
Zhong Liu / DAAC - NASA GSFC
Yoram Kaufman / NASA GSFC
|
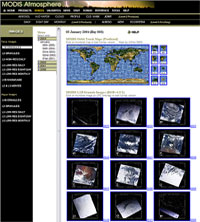
MODIS-Atmosphere Level 1B Browse System
|
|
A complete set of L1B daytime-only granules (at 1-km resolution) for both platforms for the entire data period
(February 2000 to current for Terra, and June 2002 to current for Aqua) are available for viewing and download.
Images are produced by combining MODIS bands 1, 4, & 3 in an RGB composite.
These bands were selected because they produce a near true-color representation of the scene.
Images are organized by data day, from 0000 UTC to 2400 UTC.
Each daily images page contains a full set of thumbnail images representing all the sunlit granules in sequential order;
and each thumbnail is linked (point and click) to a full-sized image.
Two over-arching user interfaces are offered.
First is a simple text-based interface for those using slow internet connections or limited (older) hardware/software.
Second is a more advanced java interface which includes collapsible/expandible data date menus along with
orbit track maps which help users locate particular granules of regional interest.
|
|
Development Team:
Paul Hubanks / Wyle, Inc.
Bill Ridgway / Science Systems & Applications, Inc.
|
Terra L1B Granules (MOD021KM)
|
Aqua L1B Granules (MYD021KM)
|
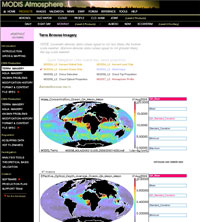
MODIS-Atmosphere Level 3 Browse System
|
A comprehensive set of statistics (mean, min, max, stddev, QA-weighted mean & stddev, and pixel counts)
for the complete set of parameters (nearly 80) for all MODIS-Atmosphere L3 (1° resolution) products (Daily, Eight Day, and Monthly)
for both platforms during the complete data period (February 2000 to current for Terra, and June 2002 to current for Aqua)
are available for viewing, comparing, and downloading.
A mouseover javascript is used to allow for easier comparison of various statistical fields.
Two display grids are offered: the native equal-angle Lat Lon grid (360x180) and an equal-area Hammer Aitoff projection.
Images are displayed using an optimized rainbow color scale, with maroon denoting values ≥ the scale max and
violet denoting values ≤ the scale min. This allows for easier detection of out of bound values and zeros.
|
|
Development Team:
Paul Hubanks / Wyle, Inc.
Brad Wind / Science Systems & Applications, Inc.
|
Terra L3 Daily (MOD08_D3)
Terra L3 Eight Day (MOD08_E3)
Terra L3 Monthly (MOD08_M3)
|
Aqua L3 Daily (MYD08_D3)
Aqua L3 Eight Day (MYD08_E3)
Aqua L3 Monthly (MYD08_M3)
|
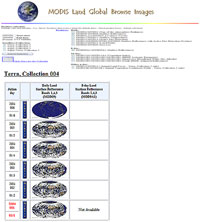
Daily Global Surface Reflectance Images (MODIS-Land)
|
The MODIS Land Science Team has developed coarse 5km versions of selected products to enable synoptic quality assessment via the internet. The coarse spatial resolution products are projected into a global coordinate system defined with pixel sizes corresponding to 20km in the Hammer-Aitoff projection. These global browse images are generated with fixed contrast stretching and color look-up tables to enable consistent temporal comparison. This web interface has been developed to support interactive selection of browse products and zooming and panning at 5km resolution. The global surface reflectance images (using bands 1/4/3) are useful for monitoring global cloud cover.
|
|
Development Team:
MODIS LDOPE, NASA Goddard Space Flight Center
MODIS Adaptative Production System (MODAPS)
MODIS Land Science Team
Space Science and Engineering Center (U. Wisconsin)
Jacques Descloitres (formerly MODIS LDOPE now MODIS Rapid Fire)
Sadashiva Devadiga (MODIS LDOPE)
Min Zheng (Laboratory for Terrestrial Physics)
|
MODIS Data Acquisition (Collection 005)
|
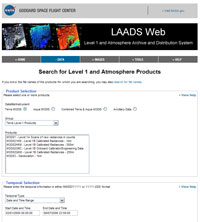
All MODIS Atmosphere data products are available to the public at no charge.
LAADS Web is the web interface to Level 1 and Atmosphere Archive and Distribution System (LAADS).
The mission of LAADS is to provide quick and easy access to Collection 005 MODIS Level 1 as well as
Level 2 and Level 3 Atmosphere Data Products.
A link to this new data ordering interface is offered below.
This new and user-friendly MODIS data ordering system
gives the user convenient means to simultaneously order several MODIS Data Sets
This system also works well for single products.
|
|
Development Team:
Karen Horrocks / NASA GSFC
Ed Masuoka / NASA GSFC
|
|
|