|
|
 |

You have accessed a U.S. Government Computer System.
Visitors are authorized to use this system to acquire MODIS-Atmosphere related data information, images, products, and services only.
Access to this system constitutes visitors consent to keystroke monitoring.
Any malicious action or intent on this system is prohibited and punishable under Federal Law.
Privacy Policy and Important Notices


 Overview
The MODIS Atmosphere Group develops remote sensing algorithms for deriving parameters pertaining to atmospheric properties of the Earth.
In order to develop conceptual and predictive global models, it is important to monitor these properties.
Two MODIS (Moderate Resolution Imaging Spectroradiometer) instruments, the first launched on 18 December 1999 onboard the Terra Platform
and the second on 4 May 2002 onboard the Aqua platform,
are uniquely designed (wide spectral range, high spatial resolution, and near daily global coverage) to observe and monitor these and other Earth conditions.
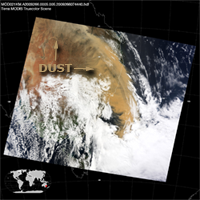
Feature L1B Granule Image
Armageddon-like Dust Storm

MODIS/Terra 9/23/09 00:05 UTC

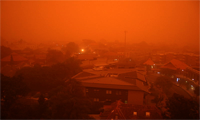
Dawn breaks over Sydney 9/23/09
click images to zoom
|
|
In September 2009, a record-breaking dust storm swept across the Australian states of New South Wales and Queensland. By 24 September, analysis using MODIS at NASA measured the length of the huge dust plume at 3,450 km.
Dust particle concentration levels reached 15,400 micrograms per cubic meter of air. (Normal days register up to 20 micrograms and bushfires generate 500 micrograms.) It was estimated that the storm carried some 16 million tons of dust from the deserts of Central Australia. During the peak of the storm, the Australian continent was estimated to be losing 75,000 tons of dust per hour off the New South Wales coast north of Sydney.
While the cloud was visible from space, on the ground the intense red-orange color and drop in temperature drew comparisons with nuclear winter (Armageddon), as well as the planet Mars. Some of the thousands of tons of soil lifted in the dust storm were dumped in Sydney Harbour and the Tasman Sea. This increased the nitrogen and phosphate levels in the water significantly. Measurements taken two weeks after the event indicated an explosion of microscopic plant life which led to an increase in fish population some months later.
(Source: Wikipedia.org)
Additional MODIS RGB images can be viewed in the L1B Granules section.
|
 Frequently Asked Questions (Quick Start Guide)
What are MODIS Data "Collections"?
How can I stay apprised of MODIS Data availability?
 A MODIS Data Processing & Availability Calendar is available that shows the latest Collection and PGE version for each MODIS Data Product on a month by month basis.
As of early 2014, a combination of Collection 006 and Collection 051 is the latest available for MODIS Atmosphere Data Products.
It should be noted that the MODIS data record began in March 2000 for Terra (10:30 LST nomimal daytime overpass) and July 2002 for Aqua (13:30 LST nominal daytime overpass).
Finally, note that MODIS Terra HDF files always begin with the prefix "MOD", while MODIS Aqua HDF files always begin with the prefix "MYD".
MODIS Data Processing & Availability Calendar
How do I order MODIS Data?
 MODIS Data is distributed free of charge through the Level 1 and Atmosphere Archive and Distribution System (LAADS).
By utilizing the Search & Order Tool on the LAADS web site, one can search and subset data by collection, date & time, geographic area, science products, and selected metadata.
Search & Order MODIS Data (LAADS web site)
It should be noted that LAADS web site searches (link above) are limited to 2000 files; so you may need to limit the time period or spatial coordinates to complete a search successfully.
If you don't want to limit either field, you can go directly to the LAADS FTP site to download data (see links below).
You will need to scroll down a bit in the FTP page to find the directories that start with "MOD" (for MODIS Terra HDF data) or "MYD" (for MODIS Aqua HDF data).
The FTP directories that start with "MOB" or "MYB" contain Terra or Aqua browse images.
FTP Download Collection 006 MODIS Data (LAADS ftp site)
FTP Download Collection 051 MODIS Data (LAADS ftp site)
How do I read, interpret, or visualize MODIS Data?
MODIS Data is stored in Heirarchical Data Format (HDF). There are a number of tools and programs already
written to read and visualize MODIS data. These include GUI, web-based, and command line programs
that are written in IDL, FORTRAN, and C. Many of these are distributed in our TOOLS section:
MODIS Data Tools (for reading & visualizing)
Users that wish to unpack Level-2 (L2) Orbital Granule MODIS data (at 1km, 5km, or 10km resolution) are advised to become familiar with the MODIS QA Plan;
which details how to read, as well as the content of the Level-2 QA arrays.
These QA arrays contain bit-flags that detail input data source, processing path, quality, as well as detailed characteristics and properties of Level-2 retrievals.
Also available on the page linked below are Algorithm Theoretical Basis Documents (ATBDs) for MODIS Data Products.
These ATBDs provide the scientific background of MODIS data.
QA Plan & ATBDs (L2 QA Flags & Science Basis)
Users working with Level-3 (L3) Daily, Eight-day, or Monthly Global Gridded MODIS data (at 1 degree resolution) are advised to become familiar with the Level-3 Algorithm Theoretical Basis Document.
This document details characteristics, properties, and content of Level-3 data. Also included in this document are user caveats and frequently asked questions. The L3 ATBD is linked
on the above 'QA Plan & ATBDs' page, as well as individual 'Theoretical Basis' pages in the L3 product sections.
The link for the 'Theoretical Basis' page in the L3 Monthly product section is provided below.
It should be noted that there is only one L3 ATBD for all L3 products (Daily, Eight-day, & Monthly).
L3 ATBD (L3 primer)
|
|
|
|
Collection 6 (C6) News
|
 C6 Data Issues -
A Data Issues (Known Problems) section for all C6 MODIS-Atmosphere data has been developed.
This section details and highlights issues with the C6 MODIS-Atmosphere data as they are discovered.
It's important for researchers and scientists, who are using MODIS Atmosphere data, to monitor this area of the website
in order to stay abreast of breaking news on data problems & anomalies -- and subsequent fixes and reruns of the data.
[C6 DATA ISSUES]
C6 Data Released -
C6 MODIS Atmosphere data has been released for both the Aqua and Terra instruments
for Aerosol (04_L2), Water Vapor (05_L2), Cloud (06_L2), Cloud Mask (35_L2), Profiles (07_L2), Joint (ATML2), Daily (08_D3), EightDay (08_E3), and Monthly (08_M3).
[L2 & L3 AVAILABILITY CALENDAR]
C6 L3 Aqua: Daily, Eight Day, and Monthly Data Images Available -
Collection 6 Level-3 data for the AQUA platform have been imaged for online browsing.
[L3 MONTHLY IMAGES]
[L3 EIGHT-DAY IMAGES]
[L3 DAILY IMAGES]
C6 Change Documentation -
C6 Update page describes Collection 6 changes to all L2 and L3 MODIS data products.
This page also includes C6 MODIS Atmospheric Product Webinar Presentations.
[C6 UPDATE PAGE]
C6 Cloud Optical Properties Users Guide -
A new "final" version 1 Cloud Optical Properties Users Guide has been completed.
The new document is dated October 2015 and has been compressed to only 6 MB in size.
Note that Cloud Optical Properties is a part of the 06_L2 MODIS data product.
[VIEW PDF]
C6 L3 ATBD & Users Guide -
A new Level-3 ATBD & Users Guide for Collection 6 is available.
[VIEW PDF]
|
|
|
MODIS Atmosphere Spotlight
|
|
Notice to Terra Data Users -
The reflective solar bands (RSB) of Terra MODIS have experienced relatively large degradation in recent years. The current calibration algorithm used in deriving the Collection 5 LUTS does not completely capture and correct for this degradation, which is both wavelength and angle-of-incidence dependent. Science data products that utilize the shorter wavelength bands, especially Bands 8 (412 nm), 9 (443 nm) and 3 (469 nm), can expect to see an observable impact in data quality.
The proposed calibration algorithm improvements in development for Collection 6 LUTs are expected to significantly reduce these impacts. These LUTs will be put into production after a thorough review and testing process is completed.
[MCST STATEMENT]
Near Real-time Hi-Res L1 & L2 Mosaics -
View near-real time mosaic images of MODIS granules
from either the Terra (February 2000 to current)
or Aqua (June 2002 to current) platforms.
[HI-RES MOSAICS]
MODIS Cloud Mask User's Guide -
This MODIS Cloud Mask User's Guide was written by Kathy Strabela (UW) in 2008.
[Cloud Mask Users Guide]
Error Found in Terra Collection 051 Data -
An error involving incorrect Clear Sky Radiances was found in the Collection 051 Terra reprocessing in HDF files with data dates prior to April 1, 2010 (2010 091).
The error impacted all Cloud-related (Cloud Top and Cloud Optical Property) SDSs.
Since this error was found, all Terra C051 data has been correctly reprocessed and updated HDF files are available for download.
However the bad C051 was distributed to users prior to September 2010.
Users of Collection 051 should make sure they did not acquire bad C051 data by following the link below, which tells you how to identify bad data.
If you acquired bad data, you should redownload the corrected data.
[IDENTIFICATION DETAILS & IMAGES]
MODIS Online Visualization and Analysis System (Giovanni MOVAS) -
This new and powerful web-based MODIS data analysis tool
is designed for visualization and analysis of the Terra / MODIS Level-3 Atmosphere Monthly global product (MOD08_M3).
Users can plot area average (area plot) and time series (time plot) or generate ASCII output for selected area and time period.
Spatial coverage is 90°N - 90°S, spatial resolution is 1° x 1°, and temporal resolution is monthly.
[MORE]
Near Real-time MODIS L1B Images -
View near-real time RGB mapped images of all daytime MODIS granules
from either the Terra (February 2000 to current)
or Aqua (June 2002 to current) platforms.
[TERRA]
[AQUA]
Near Real-time Monthly Global Images -
View monthly global images of the full set of L3 MODIS Atmosphere products
from either the Terra (March 2000 to current)
or Aqua (July 2002 to current) platforms.
[TERRA]
[AQUA]
|
|
|