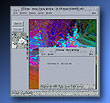
Panoply
|
 Panoply \PAN-uh-plee\, noun: 1. "A splendid or impressive array".
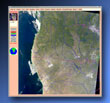
Panoply is a cross-platform application that plots geo-gridded and other arrays from netCDF, HDF, GRIB, and other datasets. With Panoply 4 you can:
1.) Slice and plot geo-gridded latitude-longitude, latitude-vertical, longitude-vertical, or time-latitude arrays from larger multidimensional variables.
2.) Slice and plot "generic" 2D arrays from larger multidimensional variables.
3,) Slice 1D arrays from larger multidimensional variables and create line plots.
4.) Combine two geo-gridded arrays in one plot by differencing, summing or averaging.
5.) Plot lon-lat data on a global or regional map using any of over 100 map projections or make a zonal average line plot.
6.) Overlay continent outlines or masks on lon-lat map plots.
7.) Use any of numerous color tables for the scale colorbar, or apply your own custom ACT, CPT, or RGB color table.
8.) Save plots to disk GIF, JPEG, PNG or TIFF bitmap images or as PDF or PostScript graphics files.
9.) Export lon-lat map plots in KMZ format.
10.) Export animations as AVI or MOV video or as a collection of invididual frame images.
11.) Explore remote THREDDS and OpenDAP catalogs and open datasets served from them.
Panoply \PAN-uh-plee\, noun: 1. "A splendid or impressive array".
Panoply is a cross-platform application that plots geo-gridded and other arrays from netCDF, HDF, GRIB, and other datasets. With Panoply 4 you can:
1.) Slice and plot geo-gridded latitude-longitude, latitude-vertical, longitude-vertical, or time-latitude arrays from larger multidimensional variables.
2.) Slice and plot "generic" 2D arrays from larger multidimensional variables.
3,) Slice 1D arrays from larger multidimensional variables and create line plots.
4.) Combine two geo-gridded arrays in one plot by differencing, summing or averaging.
5.) Plot lon-lat data on a global or regional map using any of over 100 map projections or make a zonal average line plot.
6.) Overlay continent outlines or masks on lon-lat map plots.
7.) Use any of numerous color tables for the scale colorbar, or apply your own custom ACT, CPT, or RGB color table.
8.) Save plots to disk GIF, JPEG, PNG or TIFF bitmap images or as PDF or PostScript graphics files.
9.) Export lon-lat map plots in KMZ format.
10.) Export animations as AVI or MOV video or as a collection of invididual frame images.
11.) Explore remote THREDDS and OpenDAP catalogs and open datasets served from them.


|
Cost: Free
Current Version: 4.0.4
Release Date: July 2014
Requirements: Platform & operating system specific
 Requires Java SE 6 runtime environment, or better, installed. Requires Java SE 6 runtime environment, or better, installed.
Rating:

Development Team:
Dr. Robert B. Schmunk (NASA GISS)
Compatibility:

|
Macintosh
OS-X
|

|
Microsoft Windows
Windows 7
Windows 8
|

|
Generic Version
Linux
OS/2
|
|
HDFLook
|
 A basic processing and visualization tool for MODIS HDF data within X-Window computer environments,
HDFLook can visualize structures of an HDF file including: scientific data sets (SDS), vector arrays (Vdatas and Vgroups), and
raster images (24 bits or 8 bits with a look-up table). HDFLook can visualize slices of data (up to 6 indexes), display global and local attributes, and automatically detect fill values.
HDFLook can also extract SDS ancillary data, export (raw or calibrated) SDS records to binary or HDF files, build reprojected SDS or RGB mosaics,
export RGB images to JPEG or HDF files, and print RGB images.
For programmers who routinely want jpgs or binary files, HDFLook can be run non-interactively with simple command files to routinely make images or export binary files from hdf
(see HDFLook: How To Examples).
For a more powerful tool, users should consider Msphinx (see below) which incorporates HDFLook as its HDF-EOS reader interface.
HDFLook and Msphinx are graphical user interface tools that can (correctly and fully) read and visualize the new L2 Joint Atmosphere product.
A basic processing and visualization tool for MODIS HDF data within X-Window computer environments,
HDFLook can visualize structures of an HDF file including: scientific data sets (SDS), vector arrays (Vdatas and Vgroups), and
raster images (24 bits or 8 bits with a look-up table). HDFLook can visualize slices of data (up to 6 indexes), display global and local attributes, and automatically detect fill values.
HDFLook can also extract SDS ancillary data, export (raw or calibrated) SDS records to binary or HDF files, build reprojected SDS or RGB mosaics,
export RGB images to JPEG or HDF files, and print RGB images.
For programmers who routinely want jpgs or binary files, HDFLook can be run non-interactively with simple command files to routinely make images or export binary files from hdf
(see HDFLook: How To Examples).
For a more powerful tool, users should consider Msphinx (see below) which incorporates HDFLook as its HDF-EOS reader interface.
HDFLook and Msphinx are graphical user interface tools that can (correctly and fully) read and visualize the new L2 Joint Atmosphere product.
|
Cost: Free
Current Version: 8.0
Release Date: 2006
Requirements: Platform & operating system specific
Rating:
Development Team:
Laboratoire d'Optique Atmosph�rique / U. Lille
University of Maryland / MODLAND GSFC-923
Distributed Active Archive Center (DAAC) / GSFC-902
Compatibility:
|
|
Macintosh
OS-X
|

|
Linux
Power PC
Intel
Cygwin
|
|
|
Unix
SUN-Solaris
SGI-IRIX
IBM-AIX
HP-HPUX
DEC-OSF/1
|
|
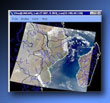
HYDRA2
|
 HYDRA (HYperspectral-viewer for Development of Research Applications) is
a freeware-based multispectral data analysis toolkit for satellite data
to assist research and development of remote sensing applications as well as education and
training of remote sensing scientists.
The University of Wisconsin-Madison SSEC is pleased to announce the release of the HYDRA2 Multispectral Data Analysis Toolkit for the visualization and analysis of JPSS Suomi-NPP and NASA EOS Aqua and Terra instrument data. This package is in support of Direct Broadcast users, and is co-sponsored by the NOAA Community Satellite Processing Package (CSPP) and the NASA International MODIS/AIRS Processing Package (IMAPP).
The HYper-spectral data viewer for Development of Research Applications version2 (HYDRA2) has been developed to assist research and development of remote sensing applications as well as education and training of remote sensing scientists. It provides a fast and flexible interface that allows users to explore and visualize relationships between sensor measurements (displayed as brightness temperatures for infrared and reflectances for visible and near infrared) and wavelength (or wavenumber) using spectra diagrams, cross sections, scatter plots, multi-band combinations, and color enhancements on a pixel by pixel basis with full access to the underlying metadata of location and time. HYDRA2 enables interrogation of multispectral (and hyperspectral) fields of data so that
pixel location and spectral measurement values can be easily displayed;
spectral bands can be combined in linear functions and the resulting images displayed;
false color images can be constructed from multiple spectral band combinations;
scatter plots of spectral band combinations can be viewed;
pixels in images can be found in scatter plots and vice versa;
transects of measurements can be displayed, and
soundings of temperature and moisture as well as spectra from selected pixels can be compared.
The instruments supported for analysis are:
1.) S-NPP: VIIRS, CrIS and ATMS;
2.) Aqua: MODIS and AIRS;
3.) Terra: MODIS;
4.) MetOP-A and B: IASI.
HYDRA (HYperspectral-viewer for Development of Research Applications) is
a freeware-based multispectral data analysis toolkit for satellite data
to assist research and development of remote sensing applications as well as education and
training of remote sensing scientists.
The University of Wisconsin-Madison SSEC is pleased to announce the release of the HYDRA2 Multispectral Data Analysis Toolkit for the visualization and analysis of JPSS Suomi-NPP and NASA EOS Aqua and Terra instrument data. This package is in support of Direct Broadcast users, and is co-sponsored by the NOAA Community Satellite Processing Package (CSPP) and the NASA International MODIS/AIRS Processing Package (IMAPP).
The HYper-spectral data viewer for Development of Research Applications version2 (HYDRA2) has been developed to assist research and development of remote sensing applications as well as education and training of remote sensing scientists. It provides a fast and flexible interface that allows users to explore and visualize relationships between sensor measurements (displayed as brightness temperatures for infrared and reflectances for visible and near infrared) and wavelength (or wavenumber) using spectra diagrams, cross sections, scatter plots, multi-band combinations, and color enhancements on a pixel by pixel basis with full access to the underlying metadata of location and time. HYDRA2 enables interrogation of multispectral (and hyperspectral) fields of data so that
pixel location and spectral measurement values can be easily displayed;
spectral bands can be combined in linear functions and the resulting images displayed;
false color images can be constructed from multiple spectral band combinations;
scatter plots of spectral band combinations can be viewed;
pixels in images can be found in scatter plots and vice versa;
transects of measurements can be displayed, and
soundings of temperature and moisture as well as spectra from selected pixels can be compared.
The instruments supported for analysis are:
1.) S-NPP: VIIRS, CrIS and ATMS;
2.) Aqua: MODIS and AIRS;
3.) Terra: MODIS;
4.) MetOP-A and B: IASI.
|
Cost: Free
Current Version: 1.0
Release Date: March 2014
Requirements: Platform & operating system specific
Rating:
Development Team:
Space Science and Engineering Center / U. Wisconsin
(Tom Rink, Tom Whittaker, Paul Menzel, Paolo Antonelli, Kevin Baggett)
Compatibility:
|
|
Microsoft Windows
Windows 7
Windows 8
|
|
|
Macintosh
OS-X
|
|
|
Linux
RedHat
|
|
Globe Grid
|
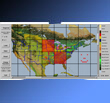 Globe Grid is a freeware grid masking tool for satellite data
to assist research and development of remote sensing applications as well as education and
training of remote sensing scientists.
Globe Grid is a freeware grid masking tool for satellite data
to assist research and development of remote sensing applications as well as education and
training of remote sensing scientists.
|
Cost: Free
Current Version: 1.2
Release Date: January 2007
Requirements: Platform & operating system specific
Rating:
Development Team:
Science Systems and Applications, Inc.
(Gala Wind)
Compatibility:
|
|
Macintosh
OS-X
|
|
|
Microsoft Windows
Windows 7
Windows 8
|
|
|
Linux
Power PC
Intel
|
|
|
Unix
SGI - IRIX
|
|
Date Converter Dashboard Widget
|
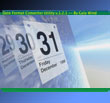 A small widget for the OSX dashboard that allows a user to convert dates between calendar and day-of-year.
Automatically adjusts for leap years. Works for all versions of OSX that have Dashboard.
A small widget for the OSX dashboard that allows a user to convert dates between calendar and day-of-year.
Automatically adjusts for leap years. Works for all versions of OSX that have Dashboard.
|
Cost: Free
Current Version: 2.0
Release Date: August 2008
Requirements: Platform & operating system specific
Rating:
Development Team:
Science Systems and Applications, Inc.
(Gala Wind)
Compatibility:
|
|
Macintosh
OS-X
|
|
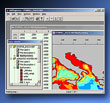
Msphinx
|
 A more powerful tool than HDFLook (outlined above), Msphinx incorporates HDFLook as its HDF reader interface.
Msphinx (Motif Satellite Process Handling Images uNder Xwindow) is a powerful image analysis, data plotting, and format conversion package.
Msphinx includes functions to process in the basic data geometry and projection planes, as well as functions to manipulate and modify the graphic display and printing.
Msphinx also includes page setting and poster setting (large size: Gigabyte PostScript files) printing capabilities.
Msphinx allows data writes from external user programs (C or Fortran) into the memory planes, background capabilities with command files, user to user data exchange (text or images), and direct links to other packages including: HDFLook (HDF file read/write), Mgraph (2D and contouring plotting), Xfig (Facility for Interactive Generation of figures), and Mpeg_Encode (mpeg format animations).
It should be noted that Msphinx and HDFLook are the only known graphical user interface tools that can (correctly and fully) read and visualize the new L2 Joint Atmosphere product.
A more powerful tool than HDFLook (outlined above), Msphinx incorporates HDFLook as its HDF reader interface.
Msphinx (Motif Satellite Process Handling Images uNder Xwindow) is a powerful image analysis, data plotting, and format conversion package.
Msphinx includes functions to process in the basic data geometry and projection planes, as well as functions to manipulate and modify the graphic display and printing.
Msphinx also includes page setting and poster setting (large size: Gigabyte PostScript files) printing capabilities.
Msphinx allows data writes from external user programs (C or Fortran) into the memory planes, background capabilities with command files, user to user data exchange (text or images), and direct links to other packages including: HDFLook (HDF file read/write), Mgraph (2D and contouring plotting), Xfig (Facility for Interactive Generation of figures), and Mpeg_Encode (mpeg format animations).
It should be noted that Msphinx and HDFLook are the only known graphical user interface tools that can (correctly and fully) read and visualize the new L2 Joint Atmosphere product.
|
Cost: Free
Current Version: 9.6
Release Date: September 2004
Requirements: Platform & operating system specific
Rating:
Development Team:
Laboratoire d'Optique Atmosph�rique / U. Lille
Compatibility:
|
|
Macintosh
OS-X
|
|
|
Linux
Power PC
Intel
Cygwin
|
|
|
Unix
SUN-Solaris
SGI-IRIX
IBM- AIX
HP-HPUX
DEC-OSF/1
|
|
McIDAS-Lite
|
 A user-friendly tool for working with MODIS HDF-EOS (or McIDAS) format data, McIDAS-Lite can be used with data files on the user's computer or remote data from public data sources. A list of publicly accessible data sources is updated each time McIDAS-Lite is started, assuring the user easy access to free data. McIDAS-Lite is available for a variety of platforms in a simple binary installation package. McIDAS-Lite can view MODIS HDF-EOS (and McIDAS) format image files, work with local or remote data, display images with your choice of geographic center point and magnification factors, place maps onto displayed images, manipulate image and graphics colors, loop through multiple images, perform basic quantitative analyses, save displayed images and graphics in other formats (GIF, JPEG, BMP, PS, PPM, or CPS), and save raw image files in netCDF format or as
flat ASCII or Binary files.
A user-friendly tool for working with MODIS HDF-EOS (or McIDAS) format data, McIDAS-Lite can be used with data files on the user's computer or remote data from public data sources. A list of publicly accessible data sources is updated each time McIDAS-Lite is started, assuring the user easy access to free data. McIDAS-Lite is available for a variety of platforms in a simple binary installation package. McIDAS-Lite can view MODIS HDF-EOS (and McIDAS) format image files, work with local or remote data, display images with your choice of geographic center point and magnification factors, place maps onto displayed images, manipulate image and graphics colors, loop through multiple images, perform basic quantitative analyses, save displayed images and graphics in other formats (GIF, JPEG, BMP, PS, PPM, or CPS), and save raw image files in netCDF format or as
flat ASCII or Binary files.
|
Cost: Free
Current Version: 1.5
Release Date: June 2004
Requirements: Platform & operating system specific
Rating:
Development Team:
Space Science and Engineering Center / U. Wisconsin
Compatibility:
|
|
Microsoft Windows
Windows 7
Windows 8
|
|
|
Macintosh
OS-X
|
|
|
Linux
RedHat
|
|
|
Unix
SUN-Solaris
SGI- IRIX
IBM- AIX
HP-HPUX
|
|
HDFExplorer
|
 A data visualization program that reads Hierarchical Data Format files (HDF, HDF-EOS and HDF5),
HDFExplorer offers a simple yet powerful interface for the visualization of HDF data. Data is first viewed in a tree-like interface, and then optionally visualized in a variety of ways.
HDFExplorer Lite is a free product, displaying data in grid view only.
HDFExplorer Pro has additional features not included in the Lite version including scalar and vector views, and exporting as either ASCII text files or a bitmap images.
A data visualization program that reads Hierarchical Data Format files (HDF, HDF-EOS and HDF5),
HDFExplorer offers a simple yet powerful interface for the visualization of HDF data. Data is first viewed in a tree-like interface, and then optionally visualized in a variety of ways.
HDFExplorer Lite is a free product, displaying data in grid view only.
HDFExplorer Pro has additional features not included in the Lite version including scalar and vector views, and exporting as either ASCII text files or a bitmap images.
|
Cost: Lite Version: Free
Pro Version: Single User $95, Student $35
Current Version: 1.3
Release Date: September 2004
Requirements: Platform & operating system specific
Rating:
Development Team:
Space Research Software
Compatibility:
|
|
Microsoft Windows
Windows 7
Windows 8
|
|
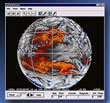
WebWinds
|
 An interactive science data visualization system written in Java and available for all major computer platforms,
WebWinds does not require any user programming experience since sessions are created by assembling components on the screen via 'point and click'.
WebWinds is modular, allowing flexibility in tool construction and application.
WebWinds is able to read and georeference MODIS Level 1, 2, or 3 data and display it as a false-color imagery
over a digital elevation map on a globe or plane. WebWinds has the ability
to easily create scripts that simplify the display of MODIS data. It also has a server component that allows large data files to
be examined in a browse mode without transferring the data to the user's client platform.
An interactive science data visualization system written in Java and available for all major computer platforms,
WebWinds does not require any user programming experience since sessions are created by assembling components on the screen via 'point and click'.
WebWinds is modular, allowing flexibility in tool construction and application.
WebWinds is able to read and georeference MODIS Level 1, 2, or 3 data and display it as a false-color imagery
over a digital elevation map on a globe or plane. WebWinds has the ability
to easily create scripts that simplify the display of MODIS data. It also has a server component that allows large data files to
be examined in a browse mode without transferring the data to the user's client platform.
|
Cost: Free
Current Version: 4.0
Release Date: December 2001
Requirements: Java version specific
Rating:
Development Team:
Jet Propulsion Laboratory
Compatibility:

|
Java
Sun/Linux Java
SGI Java
HP Java
Mac Java
Windows Java
|
|
EOSView
|
 A tool for examining, viewing and verifying HDF and HDF-EOS data files, EOSView enables the user to view the contents of HDF
files and individual objects by being able to read and display all metadata fields and data objects. Supported record types for viewing
and display capability include images, raster images, multidimensional arrays, text, tables, attributes, annotations, and vector arrays (Vdatas and Vgroups).
EOSView was developed for the Earth Observing System Data and Information System (EOSDIS) Core System (ECS).
A tool for examining, viewing and verifying HDF and HDF-EOS data files, EOSView enables the user to view the contents of HDF
files and individual objects by being able to read and display all metadata fields and data objects. Supported record types for viewing
and display capability include images, raster images, multidimensional arrays, text, tables, attributes, annotations, and vector arrays (Vdatas and Vgroups).
EOSView was developed for the Earth Observing System Data and Information System (EOSDIS) Core System (ECS).
|
Cost: Free
Current Version: 3.1
Release Date: January 2000
Requirements: Platform & operating system specific
Rating:
Development Team:
EOSDIS Core System (ECS) / GSFC
Raytheon Company
Compatibility:
|
|
Unix
SUN-Solaris
SGI-IRIX
IBM-AIX
HP-HPUX
DEC-OSF/1
|
|